
Executive Development Programme in Agri IoT Gateway Data Visualization and Reporting
This programme equips executives with insights into Agri IoT gateway data visualization and reporting, enhancing decision-making and operational efficiency.
Executive Development Programme in Agri IoT Gateway Data Visualization and Reporting
Programme Overview
The Executive Development Programme in Agri IoT Gateway Data Visualization and Reporting is designed for senior executives and professionals in the agricultural sector looking to enhance their understanding and application of Internet of Things (IoT) technologies in agronomy. This program equips participants with comprehensive knowledge of IoT gateways, data visualization techniques, and advanced reporting methodologies, enabling them to make informed strategic decisions that leverage real-time data for optimal farm management.
Participants will develop key skills in data analysis, predictive analytics, and data-driven decision-making, as well as gain proficiency in using modern data visualization tools and platforms. They will learn to interpret complex data sets and transform them into actionable insights, enhancing operational efficiency and sustainability in agricultural practices. Participants will also explore the integration of IoT gateways with existing farm management systems and learn how to implement these technologies to improve yield, reduce costs, and advance sustainable farming practices.
This program significantly impacts career progression by positioning participants as leaders in the adoption of cutting-edge agricultural technologies. Graduates will be well-equipped to lead transformative projects, enhance farm productivity, and drive innovation within their organizations. The skills acquired will not only bolster their current roles but also prepare them for more strategic and influential positions, where they can play a pivotal role in shaping the future of smart agriculture.
What You'll Learn
The Executive Development Programme in Agri IoT Gateway Data Visualization and Reporting is designed to empower leaders in the agricultural sector to navigate the digital transformation effectively. This program focuses on integrating cutting-edge IoT technologies with data visualization and reporting tools, providing participants with the skills necessary to optimize agricultural operations and enhance productivity.
Key topics include the fundamentals of IoT in agriculture, advanced data analytics, and the latest trends in data visualization software. Participants will learn to design and implement IoT gateways, analyze vast datasets to inform decision-making, and create intuitive visual reports that drive insights and action. The curriculum is enriched with hands-on workshops, case studies, and expert guest lectures from industry leaders.
Upon completion, graduates will be well-equipped to lead innovation projects, streamline operations, and improve sustainability in their agricultural enterprises. This program opens doors to roles such as IoT Project Manager, Data Analyst, or AgriTech Innovation Lead, offering opportunities to shape the future of smart agriculture. By equipping participants with a deep understanding of Agri IoT and data visualization, the program ensures they are at the forefront of technological advancements in the agricultural sector.
Programme Highlights
Industry-Aligned Curriculum
Developed with industry leaders to ensure practical, job-ready skills valued by employers worldwide.
Globally Recognised Certificate
Recognised by employers across 180+ countries as a mark of professional excellence.
Flexible Online Learning
Study at your own pace with lifetime access to all course materials and updates.
Instant Access
Start learning immediately — no application process or waiting period required.
Constantly Updated Content
Stay ahead with the latest industry trends, best practices, and emerging insights.
Career Advancement
87% of graduates report measurable career progression within 6 months of completion.
Topics Covered
- 1. Introduction to Agri IoT and Data Visualization: Learners will understand the basics of Agri IoT and data visualization, including key terminologies and concepts. They will gain foundational knowledge to interpret and visualize agricultural data effectively.
- 2. Agri IoT Gateway Hardware and Networking Basics: This module covers the hardware components of Agri IoT gateways and networking principles. Learners will learn how to configure and troubleshoot basic networking issues for effective data transmission.
- 3. Data Collection and Management in Agri IoT: Learners will study methods for collecting agricultural data using sensors and other IoT devices. They will also learn data management techniques to ensure data integrity and security.
- 4. Data Preprocessing and Cleaning: This module focuses on preprocessing and cleaning agricultural data to prepare it for analysis. Learners will gain skills in handling missing data, outlier detection, and data normalization.
- 5. Data Visualization Fundamentals: Learners will explore various data visualization techniques and tools relevant to agricultural data. They will learn how to create meaningful visualizations that can inform decision-making processes.
- 6. Advanced Data Visualization Techniques: This module delves into more complex data visualization techniques such as dashboards, geographic information systems (GIS), and predictive analytics. Learners will understand how to present data in ways that enhance user understanding and decision-making.
- 7. Report Writing and Presentation Skills: Learners will develop skills in crafting clear and concise reports based on data analysis. They will also learn how to present data findings effectively to stakeholders in the agricultural sector.
- 8. Agri IoT Gateway Security and Privacy: This module covers security measures and privacy concerns related to Agri IoT gateways. Learners will learn how to implement security protocols to protect data from breaches and ensure compliance with data protection regulations.
- 9. Case Studies in Agri IoT Data Visualization: Through real-world case studies, learners will analyze successful applications of Agri IoT data visualization in the agricultural industry. This module will provide insights into practical challenges and solutions.
- 10. Developing an Agri IoT Data Visualization Project: Learners will work on a comprehensive project where they will apply all the skills and knowledge gained throughout the programme. They will design, implement, and present an Agri IoT data visualization solution for an agricultural use case.
Everything You Get With This Programme
Key Facts
Audience: Executives in agri-tech companies
Prerequisites: Basic understanding of IoT and agriculture
Outcomes: Enhanced data visualization skills, improved report generation capabilities
Ready to Advance Your Career?
Join thousands of professionals who have transformed their careers with LSBR.
Enroll Now — $199Why This Course
Enhance Technological Expertise: Professionals in the agri-tech sector can significantly boost their technical skills through this program, particularly in IoT gateway data visualization and reporting. Understanding these tools allows them to manage and interpret complex agricultural data, leading to more informed decision-making and operational efficiency.
Strengthen Leadership Capabilities: The program includes modules on leadership and strategic management, equipping participants with the skills needed to lead and inspire teams. This development is crucial for professionals aiming to take on higher management roles within agri-tech companies or to start their own ventures.
Expand Market Knowledge: Participants gain deep insights into the latest trends and technological advancements in agri-Internet of Things (IoT). This knowledge provides a competitive edge in the market, enabling professionals to stay ahead and effectively integrate new technologies into existing business models.
Improve Data-Driven Decision Making: By mastering data visualization and reporting techniques, professionals can transform raw data into actionable insights. This capability is vital for optimizing agricultural practices, improving yields, and enhancing overall business performance, making data-driven decisions a cornerstone of their work.
Estimated Completion
3-4 Weeks
Path to Certification
1. Enroll
Sign up and get instant access to all course materials.
2. Learn
Study at your own pace with expert-designed content.
3. Complete
Finish the programme in as little as 3-4 weeks.
4. Get Certified
Receive your industry-recognised certificate from LSBR.
Join Our Global Alumni Network
0
Graduates +
0
Career Growth %
0
Salary Increase %
0
Countries +
Course Brochure
Download our comprehensive course brochure with all details
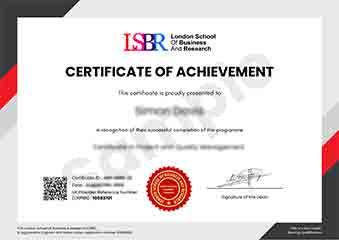
Sample Certificate
Preview the certificate you'll receive upon successful completion of this program.
Get Free Course Info
Enter your email and we'll send you the full course details, curriculum, and pricing information.
Is Your Employer Paying?
Many employers cover the cost of professional development. Request a corporate invoice and we'll handle everything — from enrolment to certification.
Trusted by 2,500+ Companies
From startups to Fortune 500 companies across 180+ countries.
What People Say About Us
Hear from our students about their experience with the Executive Development Programme in Agri IoT Gateway Data Visualization and Reporting at LSBR School of Professional Development.
James Thompson
United Kingdom"The course content was incredibly detailed and well-structured, providing a solid foundation in Agri IoT gateway data visualization and reporting. I gained practical skills that are directly applicable to real-world scenarios, which I believe will significantly enhance my career prospects in the agricultural technology sector."
Ashley Rodriguez
United States"The Executive Development Programme in Agri IoT Gateway Data Visualization and Reporting has significantly enhanced my ability to analyze and interpret complex agricultural data, making me more competitive in the industry. This course has not only provided me with practical tools for data visualization but also deepened my understanding of how to leverage IoT data for strategic decision-making, which has opened up new career opportunities in data-driven agricultural management."
Klaus Mueller
Germany"The course structure was meticulously organized, providing a seamless transition from theoretical concepts to practical applications in agri-iot data visualization and reporting, which significantly enhanced my understanding and prepared me for real-world challenges."
12 people are viewing this course right now