
Executive Development Programme in Seaborn for Statistical Data Poster Creation
Learn Seaborn for statistical data posters, enhancing your data visualization expertise.
Executive Development Programme in Seaborn for Statistical Data Poster Creation
Programme Overview
The Executive Development Programme in Seaborn for Statistical Data Poster Creation is a comprehensive, hands-on training designed for professionals in data science, business intelligence, and research roles who need to effectively communicate complex data insights through visually compelling posters. This program equips participants with advanced skills in utilizing Seaborn, a Python data visualization library, to create sophisticated and engaging statistical graphics that enhance data storytelling and decision-making processes.
Participants will develop skills in creating a wide range of statistical plots, including but not limited to violin plots, heatmaps, and joint distributions, using Seaborn and Python. They will learn to customize these plots to fit specific data contexts, ensuring that the visualizations are both accurate and aesthetically pleasing. The program also covers best practices for data presentation, how to select appropriate visualizations for different types of data, and how to integrate Seaborn with other Python libraries like Matplotlib and Pandas for a more robust data analysis workflow.
This programme has a significant impact on career advancement, particularly for those aiming to become data analysts, data scientists, or business intelligence specialists. By mastering Seaborn and data visualization techniques, professionals can significantly improve their ability to convey complex data insights effectively, thereby making them highly valuable assets in any organization. The ability to create clear, insightful, and visually appealing data posters can help drive data-driven decisions, foster better communication within teams, and enhance the overall impact of data presentations.
What You'll Learn
Transform your data visualization skills with the 'Executive Development Programme in Seaborn for Statistical Data Poster Creation.' This comprehensive program equips you with advanced skills in creating impactful and insightful statistical posters using Seaborn, a powerful data visualization library in Python. By the end of the program, you will master the creation of engaging, publication-quality visualizations that effectively communicate complex data relationships and trends.
Key topics include the fundamentals of Seaborn, statistical visualization techniques, and best practices for poster design. You will learn to leverage Seaborn’s capabilities to analyze and present data from various datasets, ensuring your visualizations are accurate, clear, and compelling. Practical, hands-on workshops will guide you through the entire process, from data preparation to final poster design.
This program is designed for data analysts, researchers, and professionals in fields such as finance, healthcare, and social sciences who need to present data-driven insights. Graduates can apply their skills to create posters for presentations, reports, and publications, enhancing their ability to communicate complex data effectively. The program also opens doors to career advancements, including roles as data visualization specialists, statistical analysts, and data science managers. By mastering Seaborn, you will be well-prepared to lead data-driven projects and make informed decisions based on robust visual evidence.
Programme Highlights
Industry-Aligned Curriculum
Developed with industry leaders to ensure practical, job-ready skills valued by employers worldwide.
Globally Recognised Certificate
Recognised by employers across 180+ countries as a mark of professional excellence.
Flexible Online Learning
Study at your own pace with lifetime access to all course materials and updates.
Instant Access
Start learning immediately — no application process or waiting period required.
Constantly Updated Content
Stay ahead with the latest industry trends, best practices, and emerging insights.
Career Advancement
87% of graduates report measurable career progression within 6 months of completion.
Topics Covered
- 1. Introduction to Seaborn and Python for Data Visualization: Learners will be introduced to Seaborn, a powerful data visualization library built on top of Matplotlib, and Python programming. They will gain foundational skills in setting up their environment, basic data manipulation, and creating simple visualizations.
- 2. Descriptive Statistics and Data Exploration Techniques: This module covers essential statistical concepts and techniques for exploring and summarizing data. Learners will learn to calculate and interpret descriptive statistics, visualize distributions, and understand key data exploration methods using Seaborn.
- 3. Working with Datasets and Data Cleaning: Learners will practice importing, cleaning, and preprocessing various datasets. They will gain skills in handling missing data, outliers, and data inconsistencies, preparing them for advanced visualization tasks.
- 4. Creating Univariate and Bivariate Plots: This module focuses on visualizing single and paired variables. Learners will create and customize univariate plots (e.g., histograms, KDE plots) and bivariate plots (e.g., scatter plots, line plots) to gain insights into their data.
- 5. Advanced Plotting Techniques for Categorical Data: Building on basic plotting skills, learners will explore techniques for visualizing categorical data, including bar plots, box plots, violin plots, and swarm plots, enhancing their ability to communicate complex data relationships effectively.
- 6. Customizing Visuals and Aesthetics: This module covers advanced customization options for Seaborn plots, including color palettes, styles, and themes. Learners will learn to create visually appealing and informative plots that meet professional standards.
- 7. Statistical Plotting and Hypothesis Testing: Learners will delve into statistical plotting techniques, including regression plots and correlation matrices. They will also perform hypothesis testing and learn how to interpret the results visually.
- 8. Creating Interactive and Dynamic Data Visualizations: This module introduces learners to interactive and dynamic visualizations using Seaborn and Plotly. They will learn how to create and enhance interactive plots that allow users to explore data in real-time.
- 9. Best Practices for Data Visualization and Storytelling: Focusing on the principles of effective data storytelling, learners will learn how to design visualizations that effectively communicate insights and tell compelling stories. They will also practice creating comprehensive data reports and presentations.
- 10. Real-World Application Projects: In this final module, learners will apply their skills to real-world projects, working on complex data sets from various domains. They will gain experience in end-to-end data visualization workflows, from data preparation to final presentation.
Everything You Get With This Programme
Key Facts
Audience: Data analysts, business managers
Prerequisites: Basic statistics knowledge, Seaborn experience
Outcomes: Advanced data visualization skills, Enhanced poster creation abilities
Ready to Advance Your Career?
Join thousands of professionals who have transformed their careers with LSBR.
Enroll Now — $199Why This Course
Enhance Data Visualization Skills: The programme focuses on leveraging Seaborn, a powerful Python data visualization library. Participants will learn to create sophisticated, publication-quality plots that effectively communicate complex data insights, a critical skill in data analysis and reporting.
Boost Career Competitiveness: With the increasing demand for data-driven decision-making, proficiency in Seaborn can significantly enhance one's career prospects. Employers value professionals who can translate data into compelling visual stories, making programme graduates more attractive to potential employers and more valuable in their roles.
Strengthen Data Communication: The course equips professionals with the ability to craft clear, intuitive data visualizations. This not only aids in internal communication within organizations but also in client presentations, where clear data representation is crucial for building trust and making a persuasive case.
Develop Advanced Analytical Techniques: Beyond Seaborn, the programme introduces advanced analytical techniques that complement statistical data analysis. These skills enable professionals to conduct in-depth data exploration and provide deeper insights, contributing to more informed strategic decisions.
Estimated Completion
3-4 Weeks
Path to Certification
1. Enroll
Sign up and get instant access to all course materials.
2. Learn
Study at your own pace with expert-designed content.
3. Complete
Finish the programme in as little as 3-4 weeks.
4. Get Certified
Receive your industry-recognised certificate from LSBR.
Join Our Global Alumni Network
0
Graduates +
0
Career Growth %
0
Salary Increase %
0
Countries +
Course Brochure
Download our comprehensive course brochure with all details
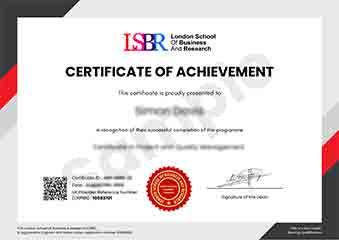
Sample Certificate
Preview the certificate you'll receive upon successful completion of this program.
Get Free Course Info
Enter your email and we'll send you the full course details, curriculum, and pricing information.
Is Your Employer Paying?
Many employers cover the cost of professional development. Request a corporate invoice and we'll handle everything — from enrolment to certification.
Trusted by 2,500+ Companies
From startups to Fortune 500 companies across 180+ countries.
What People Say About Us
Hear from our students about their experience with the Executive Development Programme in Seaborn for Statistical Data Poster Creation at LSBR School of Professional Development.
Charlotte Williams
United Kingdom"This course provided high-quality materials that significantly enhanced my ability to create effective statistical data posters using Seaborn. I gained practical skills that have already proven invaluable in my work, allowing me to present data more clearly and professionally."
Priya Sharma
India"The Executive Development Programme in Seaborn for Statistical Data Poster Creation has significantly enhanced my ability to create impactful visualizations, making my data analysis projects more compelling and industry-ready. This skill has not only improved my工作效率和数据展示能力,还为我在求职中增添了不少亮点,帮助我在竞争激烈的市场中脱颖而出。"
Fatimah Ibrahim
Malaysia"The course structure is well-organized, providing a seamless transition from basic to advanced concepts in Seaborn, which greatly enhances my ability to create effective statistical data posters. The comprehensive content and real-world applications have significantly boosted my professional skills in data visualization."
12 people are viewing this course right now