
Postgraduate Certificate in Interactive Data Visualization Best Practices
Gain advanced skills in data visualization best practices for effective communication and decision-making.
Postgraduate Certificate in Interactive Data Visualization Best Practices
Programme Overview
The Postgraduate Certificate in Interactive Data Visualization Best Practices is tailored for professionals and students seeking to enhance their data visualization skills with a focus on interactive techniques and best practices. This program equips learners with the ability to design, develop, and implement interactive visualizations that effectively communicate complex data insights. It covers a range of topics, including data manipulation and cleaning, tool proficiency (such as Tableau, D3.js, and Power BI), and the principles of effective data storytelling.
Learners will develop a comprehensive set of skills, including data analysis, visualization design, and interactive dashboard creation. The curriculum emphasizes the importance of user-centric design, accessibility, and the ethical considerations of data representation. Through hands-on projects and case studies, participants will gain practical experience in creating interactive visualizations that not only present data clearly but also engage and inform a diverse audience.
Upon completion, graduates will be well-prepared to take on leadership roles in data visualization projects or advance their careers in data science, analytics, or related fields. The program's focus on current best practices ensures that graduates are equipped to meet the demands of a rapidly evolving data landscape, enhancing their ability to drive informed decision-making and strategic planning in their organizations.
What You'll Learn
Embark on a transformative journey with the Postgraduate Certificate in Interactive Data Visualization Best Practices. This cutting-edge program equips you with the skills to create compelling visual narratives from complex data sets, essential for today’s data-driven world. You will delve into key areas such as data storytelling, interactive visualization techniques, and cutting-edge tools like Tableau and D3.js. The curriculum also covers ethical considerations in data visualization and the latest trends in AI and machine learning applications.
By the end of the program, you will be able to translate raw data into intuitive, engaging visual stories that drive decision-making in various sectors, from healthcare and finance to marketing and technology. Graduates are prepared to enhance business intelligence, improve user engagement, and drive strategic insights for data-driven initiatives.
This program opens doors to a wide array of career opportunities, including data analyst, data scientist, business intelligence analyst, and visualization specialist. Whether you are looking to advance in your current role or transition into a new field, this certificate will provide you with the practical skills and knowledge needed to succeed in the dynamic landscape of data visualization. Join us in shaping the future of how data tells its story.
Programme Highlights
Industry-Aligned Curriculum
Developed with industry leaders to ensure practical, job-ready skills valued by employers worldwide.
Globally Recognised Certificate
Recognised by employers across 180+ countries as a mark of professional excellence.
Flexible Online Learning
Study at your own pace with lifetime access to all course materials and updates.
Instant Access
Start learning immediately — no application process or waiting period required.
Constantly Updated Content
Stay ahead with the latest industry trends, best practices, and emerging insights.
Career Advancement
87% of graduates report measurable career progression within 6 months of completion.
Topics Covered
- 1. Fundamentals of Data Visualization: Learners will study the principles of effective data visualization, including color theory, chart selection, and storytelling with data. They will gain skills in creating basic visualizations using tools like Tableau and D3.js.
- 2. Data Preparation and Cleaning: This module covers techniques for preparing and cleaning data for visualization, including data wrangling, normalization, and handling missing values. Learners will practice data manipulation using Python and R.
- 3. Interactive Visualization Techniques: Learners will explore interactive visualization methods and tools, such as tooltips, filters, and sliders. They will create interactive dashboards using JavaScript and libraries like Plotly and Bokeh.
- 4. Advanced Data Encoding: This module delves into advanced encoding techniques, including dual-axes, small multiples, and geo-spatial data visualization. Learners will apply these techniques to real-world datasets.
- 5. User Experience and Design: Learners will learn how to design for user experience in interactive visualizations, including accessibility, usability, and visual aesthetics. They will create a user-centered design for a visualization project.
- 6. Data Visualization in Web Applications: This module focuses on integrating interactive visualizations into web applications using frameworks like React and Vue.js. Learners will develop a complete web application with interactive visualizations.
- 7. Visualization for Data Science: Learners will apply visualization techniques to data science projects, including exploratory data analysis and predictive modeling. They will use visualization to communicate insights from data science analyses.
- 8. Data Visualization Ethics and Best Practices: This module covers ethical considerations in data visualization, including bias, transparency, and privacy. Learners will develop a code of best practices for ethical data visualization.
- 9. Advanced Storytelling with Data: Learners will learn advanced storytelling techniques for data visualization, including narrative structure, pacing, and engaging visuals. They will create a comprehensive data visualization story.
- 10. Portfolio and Presentation: In this final module, learners will compile a portfolio of their best work from the course and present it to a panel of experts. They will reflect on their learning journey and how to continue developing their skills in data visualization.
Everything You Get With This Programme
Key Facts
Audience:专业人士,数据分析爱好者
Prerequisites:本科背景,基础统计知识
Outcomes:掌握数据可视化工具,提升分析技能
Ready to Advance Your Career?
Join thousands of professionals who have transformed their careers with LSBR.
Enroll Now — $149Why This Course
Enhance Data Communication Skills: A Postgraduate Certificate in Interactive Data Visualization Best Practices equips professionals with advanced techniques to transform complex data into engaging, easy-to-understand visual representations. This skill is crucial in fields like finance, healthcare, and technology, where clear communication of data insights can drive strategic decisions.
Boost Employment Opportunities: Organizations increasingly seek professionals who can analyze and present data effectively. Holding this certificate can make candidates more attractive to employers, opening up opportunities in data science, business analytics, and research roles. It also enables professionals to transition into specialized roles focused on data visualization.
Develop Cutting-Edge Technical Know-How: The program covers the latest tools and platforms used in interactive data visualization, such as Tableau, QlikView, and D3.js. Gaining proficiency in these tools can significantly enhance a professional’s ability to handle large datasets and create dynamic, interactive visualizations, making them indispensable in data-driven industries.
Foster Critical Thinking and Problem Solving: Through hands-on projects and case studies, participants learn to identify the most effective ways to visualize data based on the specific needs of different stakeholders. This process sharpens critical thinking and problem-solving skills, which are valuable across various professional settings.
Estimated Completion
3-4 Weeks
Path to Certification
1. Enroll
Sign up and get instant access to all course materials.
2. Learn
Study at your own pace with expert-designed content.
3. Complete
Finish the programme in as little as 3-4 weeks.
4. Get Certified
Receive your industry-recognised certificate from LSBR.
Join Our Global Alumni Network
0
Graduates +
0
Career Growth %
0
Salary Increase %
0
Countries +
Course Brochure
Download our comprehensive course brochure with all details
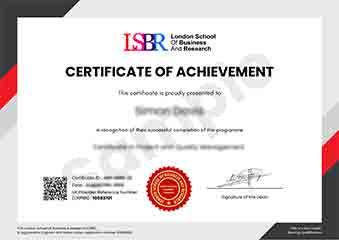
Sample Certificate
Preview the certificate you'll receive upon successful completion of this program.
Get Free Course Info
Enter your email and we'll send you the full course details, curriculum, and pricing information.
Is Your Employer Paying?
Many employers cover the cost of professional development. Request a corporate invoice and we'll handle everything — from enrolment to certification.
Trusted by 2,500+ Companies
From startups to Fortune 500 companies across 180+ countries.
What People Say About Us
Hear from our students about their experience with the Postgraduate Certificate in Interactive Data Visualization Best Practices at LSBR School of Professional Development.
Oliver Davies
United Kingdom"The course provided an in-depth look at best practices in interactive data visualization, equipping me with practical skills to create effective visualizations that enhance data understanding. It has significantly boosted my ability to communicate complex data in a clear and engaging manner, which is invaluable for my career in data analysis."
Oliver Davies
United Kingdom"This course has been incredibly practical and industry-relevant, equipping me with advanced skills in data visualization that I've directly applied to enhance my projects at work, leading to more effective communication of complex data and better-informed decision-making processes. It's been a game-changer for my career, opening up new opportunities in data-driven roles."
Zoe Williams
Australia"The course structure is well-organized, providing a clear path from foundational concepts to advanced techniques in interactive data visualization, which has significantly enhanced my ability to apply these skills in real-world scenarios."
12 people are viewing this course right now