
Professional Certificate in Traffic Data Visualization and Reporting Techniques
Elevate your skills in traffic data visualization and reporting with this certificate, enhancing analytical capabilities and decision-making.
Professional Certificate in Traffic Data Visualization and Reporting Techniques
Programme Overview
The Professional Certificate in Traffic Data Visualization and Reporting Techniques is designed to equip professionals with the skills necessary to analyze, visualize, and report on complex traffic data effectively. This program is ideal for data analysts, traffic engineers, urban planners, and researchers who need to interpret large datasets and communicate insights through compelling visual representations. Participants will learn to use advanced data visualization tools and statistical methods to enhance decision-making processes in the context of transportation and urban planning.
Key skills and knowledge developed through this program include the ability to select appropriate visualization techniques for different types of traffic data, perform data cleaning and preprocessing, and create interactive dashboards for real-time traffic analysis. Learners will also master the use of programming languages such as Python and R for data manipulation and analysis, and will gain proficiency in tools like Tableau and QGIS for data visualization. These skills are crucial for creating actionable reports that can inform policy decisions and improve traffic management systems.
The career impact of this program is significant, as it prepares graduates to advance in their roles by enhancing their data analysis capabilities and visual communication skills. Participants will be well-equipped to take on leadership roles in data-driven decision-making processes in transportation departments, consulting firms, and research institutions. They will also be able to contribute to the development of smarter, more efficient urban transportation systems by leveraging data visualization to support evidence-based planning and policy.
What You'll Learn
The Professional Certificate in Traffic Data Visualization and Reporting Techniques is a comprehensive program designed to empower professionals in traffic management, urban planning, and data analytics with advanced skills in visualizing and reporting traffic data. This program equips learners with the knowledge and tools to transform raw traffic data into actionable insights, enhancing decision-making processes and improving traffic flow efficiency.
Key topics include data collection methods, data cleaning and preprocessing, data visualization best practices, and advanced reporting techniques. Through hands-on workshops, learners will master the use of popular data visualization tools such as Tableau, Power BI, and Python for data analysis. Case studies and real-world projects ensure that participants can apply their skills to complex traffic scenarios, leading to more effective traffic management strategies and policy recommendations.
Upon completion, graduates will be well-prepared to analyze and present traffic data, contributing to the development of safer and more efficient transportation systems. Career opportunities abound in government agencies, urban planning firms, transportation consultancy firms, and tech companies, where demand for skilled data analysts and traffic data specialists is growing. This certificate not only enhances employability but also paves the way for leadership roles in traffic management and urban planning.
Programme Highlights
Industry-Aligned Curriculum
Developed with industry leaders to ensure practical, job-ready skills valued by employers worldwide.
Globally Recognised Certificate
Recognised by employers across 180+ countries as a mark of professional excellence.
Flexible Online Learning
Study at your own pace with lifetime access to all course materials and updates.
Instant Access
Start learning immediately — no application process or waiting period required.
Constantly Updated Content
Stay ahead with the latest industry trends, best practices, and emerging insights.
Career Advancement
87% of graduates report measurable career progression within 6 months of completion.
Topics Covered
- 1. Introduction to Traffic Data and Visualization: Learners will understand the basics of traffic data, its sources, and importance. They will learn foundational concepts of data visualization, including choosing appropriate visual tools and techniques.
- 2. Data Collection and Cleaning: Learners will explore methods for collecting traffic data and techniques for cleaning and preparing data for visualization. Practical skills include data validation, error detection, and data normalization.
- 3. Fundamentals of Data Visualization: This module covers basic principles of data visualization, such as color theory, chart types, and effective labeling. Learners will gain skills in creating clear and informative visualizations.
- 4. Interactive Data Visualization: Learners will delve into interactive visualization tools and techniques, including hover effects, zooming, and filtering. Practical skills include creating interactive dashboards and stories with data.
- 5. Geospatial Data Visualization: This module focuses on visualizing traffic data in geographic context. Learners will learn to use mapping tools and techniques for displaying spatial data, such as heat maps and route analysis.
- 6. Advanced Visualization Techniques: Learners will explore advanced visualization techniques, including time series analysis, correlation charts, and predictive modeling. Practical skills include building comprehensive reports and dashboards.
- 7. Reporting Best Practices: This module covers best practices for creating professional reports and presentations. Learners will learn how to structure reports, use effective visuals, and ensure data accuracy and integrity.
- 8. Data Visualization with Python: Learners will gain hands-on experience using Python for data visualization. This includes using libraries such as Matplotlib, Seaborn, and Plotly to create dynamic and interactive visualizations.
- 9. Data Visualization with R: This module teaches learners to use R for data visualization. They will learn to create complex visualizations using ggplot2 and other R packages, as well as how to integrate R with Shiny for web-based applications.
- 10. Real-World Project: Learners will work on a comprehensive project where they apply all learned skills to analyze and visualize real traffic data. This module will culminate in a final report and presentation.
Everything You Get With This Programme
Key Facts
Professionals seeking data visualization skills
No prior experience required
Learn to create impactful visualizations
Master reporting techniques for traffic data
Enhance data communication abilities
Apply knowledge in real-world scenarios
Ready to Advance Your Career?
Join thousands of professionals who have transformed their careers with LSBR.
Enroll Now — $149Why This Course
Enhance Analytical Skills: Obtaining a Professional Certificate in Traffic Data Visualization and Reporting Techniques equips professionals with advanced analytical skills, enabling them to interpret complex traffic data more effectively. This skill set is crucial for roles in transportation management, urban planning, and data analysis, where the ability to derive actionable insights from data can significantly impact decision-making processes.
Boost Career Advancement: This certification can be a pivotal step in career progression, particularly for those looking to specialize in data-driven roles within the transportation sector. It opens doors to higher-level positions such as data analysts, data scientists, or traffic management specialists, where expertise in data visualization and reporting is highly valued.
Develop Marketable Skills: The certificate provides professionals with marketable skills that are in high demand. As cities increasingly focus on smart transportation solutions, individuals with expertise in traffic data visualization and reporting are essential for optimizing traffic flow, improving public transit systems, and enhancing safety measures. These skills are particularly relevant in the growing fields of smart cities and urban planning.
Improve Communication and Reporting: Effective communication of data insights is critical in the transportation industry. The certificate teaches professionals how to create clear, concise, and visually appealing reports and presentations, which can improve stakeholder engagement and decision-making. This enhances the ability to convey complex data to non-technical audiences, making it easier to implement traffic management strategies and improvements.
Estimated Completion
3-4 Weeks
Path to Certification
1. Enroll
Sign up and get instant access to all course materials.
2. Learn
Study at your own pace with expert-designed content.
3. Complete
Finish the programme in as little as 3-4 weeks.
4. Get Certified
Receive your industry-recognised certificate from LSBR.
Join Our Global Alumni Network
0
Graduates +
0
Career Growth %
0
Salary Increase %
0
Countries +
Course Brochure
Download our comprehensive course brochure with all details
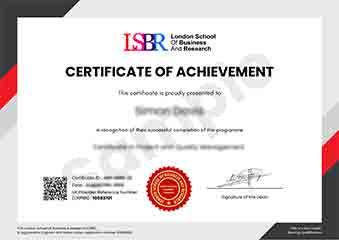
Sample Certificate
Preview the certificate you'll receive upon successful completion of this program.
Get Free Course Info
Enter your email and we'll send you the full course details, curriculum, and pricing information.
Is Your Employer Paying?
Many employers cover the cost of professional development. Request a corporate invoice and we'll handle everything — from enrolment to certification.
Trusted by 2,500+ Companies
From startups to Fortune 500 companies across 180+ countries.
What People Say About Us
Hear from our students about their experience with the Professional Certificate in Traffic Data Visualization and Reporting Techniques at LSBR School of Professional Development.
Oliver Davies
United Kingdom"The course content is incredibly comprehensive, covering everything from basic data visualization techniques to advanced reporting strategies, which has significantly enhanced my ability to analyze and present traffic data effectively. Gaining these skills has opened up new opportunities in my career, allowing me to contribute more value to my team's projects."
Kavya Reddy
India"This course has been incredibly valuable, equipping me with advanced data visualization techniques that are directly applicable in traffic management roles. It has not only enhanced my analytical skills but also opened up new career opportunities in the field of transportation analytics."
Jia Li Lim
Singapore"The course structure is well-organized, providing a clear path from basic concepts to advanced visualization techniques, which has significantly enhanced my ability to create effective traffic reports for real-world scenarios."
12 people are viewing this course right now