
Undergraduate Certificate in Designing Dynamic Data Visualizations for Presentations
Enhance presentation skills with interactive and engaging data visualizations, boosting audience engagement and communication effectiveness instantly.
Undergraduate Certificate in Designing Dynamic Data Visualizations for Presentations
Programme Overview
This course is for undergraduate students and professionals seeking to enhance their data visualization skills.
They will gain hands-on experience in designing dynamic data visualizations for presentations, learning to effectively communicate complex data insights and create engaging visual stories.
What You'll Learn
Unlock the power of data storytelling with our Undergraduate Certificate in Designing Dynamic Data Visualizations for Presentations. This program equips you with the skills to transform complex data into engaging, interactive visuals that captivate audiences. By mastering data visualization tools and techniques, you'll enhance your presentations, reports, and dashboards, setting yourself apart in the job market. Career opportunities abound in fields like business, marketing, and research. Our certificate program offers hands-on training, real-world projects, and expert instruction, ensuring you gain practical experience and a portfolio of work to showcase your skills. Elevate your professional profile and make data-driven decisions with confidence. Enroll now and discover the impact of dynamic data visualizations on your career.
Programme Highlights
Industry-Aligned Curriculum
Developed with industry leaders to ensure practical, job-ready skills valued by employers worldwide.
Globally Recognised Certificate
Recognised by employers across 180+ countries as a mark of professional excellence.
Flexible Online Learning
Study at your own pace with lifetime access to all course materials and updates.
Instant Access
Start learning immediately — no application process or waiting period required.
Constantly Updated Content
Stay ahead with the latest industry trends, best practices, and emerging insights.
Career Advancement
87% of graduates report measurable career progression within 6 months of completion.
Topics Covered
- Introduction to Data Visualization: Learn data visualization basics.
- Design Principles and Practices: Apply design principles effectively.
- Data Preparation and Analysis: Prepare data for visualization.
- Visualization Tools and Software: Master visualization tools and software.
- Storytelling with Data Visualizations: Tell stories with data visuals.
- Presentation and Communication: Communicate insights effectively always.
Everything You Get With This Programme
Key Facts
Audience: Working professionals
Prerequisites: Basic computer skills
Outcomes: Enhanced presentation skills
Ready to Advance Your Career?
Join thousands of professionals who have transformed their careers with LSBR.
Enroll Now — $99Why This Course
Learners should pick the Undergraduate Certificate in Designing Dynamic Data Visualizations for Presentations for its unique benefits:
Enhance presentation skills with interactive and engaging visualizations
Develop ability to effectively communicate complex data insights
Gain practical experience with industry-standard tools and technologies to create impactful presentations
Estimated Completion
3-4 Weeks
Path to Certification
1. Enroll
Sign up and get instant access to all course materials.
2. Learn
Study at your own pace with expert-designed content.
3. Complete
Finish the programme in as little as 3-4 weeks.
4. Get Certified
Receive your industry-recognised certificate from LSBR.
Join Our Global Alumni Network
0
Graduates +
0
Career Growth %
0
Salary Increase %
0
Countries +
Course Brochure
Download our comprehensive course brochure with all details
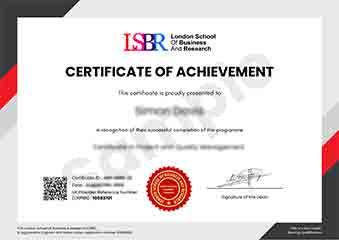
Sample Certificate
Preview the certificate you'll receive upon successful completion of this program.
Get Free Course Info
Enter your email and we'll send you the full course details, curriculum, and pricing information.
Is Your Employer Paying?
Many employers cover the cost of professional development. Request a corporate invoice and we'll handle everything — from enrolment to certification.
Trusted by 2,500+ Companies
From startups to Fortune 500 companies across 180+ countries.
What People Say About Us
Hear from our students about their experience with the Undergraduate Certificate in Designing Dynamic Data Visualizations for Presentations at LSBR School of Professional Development.
Charlotte Williams
United Kingdom"The course material was incredibly comprehensive and well-structured, covering a wide range of data visualization tools and techniques that I can now confidently apply to real-world projects. Through this course, I gained hands-on experience in creating interactive and dynamic visualizations that effectively communicate complex data insights, which has significantly enhanced my skills in presenting data-driven stories. I feel more equipped to take on challenging roles in my career, where data visualization plays a critical part in driving business decisions."
Klaus Mueller
Germany"The Undergraduate Certificate in Designing Dynamic Data Visualizations for Presentations has been a game-changer for my career, equipping me with the skills to effectively communicate complex data insights and drive business decisions. I've seen a significant boost in my ability to create engaging and informative visualizations that resonate with both technical and non-technical stakeholders, making me a more valuable asset to my organization. By mastering the art of data visualization, I've been able to take on more challenging projects and pursue leadership roles, opening up new avenues for career advancement and growth."
Hans Weber
Germany"The course structure was well-organized and easy to follow, allowing me to build a strong foundation in designing dynamic data visualizations and gradually apply this knowledge to real-world presentation scenarios. I appreciated the comprehensive content, which covered a wide range of topics and provided me with a deeper understanding of how to effectively communicate complex data insights. Through this course, I gained valuable skills that will undoubtedly enhance my professional growth and ability to create engaging presentations."
12 people are viewing this course right now