
Undergraduate Certificate in Visualizing Data Over Time with Python
Earn an Undergraduate Certificate in visualizing data over time with Python, gaining skills in data analysis and actionable insights.
Undergraduate Certificate in Visualizing Data Over Time with Python
Programme Overview
The Undergraduate Certificate in Visualizing Data Over Time with Python is a specialized programme designed for students and professionals aiming to enhance their data analysis and visualization skills using Python. This programme is ideal for those in fields such as data science, business analytics, and research, who seek to effectively communicate data trends over time through sophisticated visual representations. It also caters to individuals looking to transition into data-related roles or advance their careers by leveraging Python's powerful data manipulation and visualization libraries.
Participants will develop a deep understanding of data visualization principles and gain proficiency in using Python for data analysis and time-series visualization. Key skills include the ability to clean and preprocess data, select appropriate visualization techniques for different data types and time frames, and create interactive and dynamic visualizations. Learners will master the use of Python libraries such as Pandas, Matplotlib, Seaborn, and Plotly, and learn how to interpret and communicate insights derived from visual data representations.
Upon completion, learners will be well-equipped to impact their professional careers by effectively visualizing and presenting complex data trends over time. They will be prepared to take on roles that require advanced data visualization skills, such as data analysts, business intelligence specialists, and data scientists. The programme also offers practical applications in areas like financial analysis, market research, and social science studies, enabling graduates to contribute meaningfully to data-driven decision-making processes in various industries.
What You'll Learn
The Undergraduate Certificate in Visualizing Data Over Time with Python is designed to equip students with the essential skills to analyze and visualize temporal data using Python, a powerful programming language renowned for its simplicity and efficiency. This program delves into the core principles of data visualization, time series analysis, and Python programming. Key topics include data manipulation with libraries such as Pandas, visualization techniques with Matplotlib and Seaborn, and advanced data analysis with NumPy and SciPy.
Participants will learn to create compelling visual stories from temporal data, enabling them to identify trends, patterns, and anomalies over time. By the end of the program, students will have practical experience in analyzing datasets from various domains, including finance, healthcare, and social sciences.
Graduates will be well-prepared for roles that require data analysis and visualization. They can pursue careers in data science, business intelligence, research, and software development. With a strong foundation in Python and data visualization, these professionals will be adept at transforming raw data into insightful visual representations, driving informed decision-making in their organizations.
Programme Highlights
Industry-Aligned Curriculum
Developed with industry leaders to ensure practical, job-ready skills valued by employers worldwide.
Globally Recognised Certificate
Recognised by employers across 180+ countries as a mark of professional excellence.
Flexible Online Learning
Study at your own pace with lifetime access to all course materials and updates.
Instant Access
Start learning immediately — no application process or waiting period required.
Constantly Updated Content
Stay ahead with the latest industry trends, best practices, and emerging insights.
Career Advancement
87% of graduates report measurable career progression within 6 months of completion.
Topics Covered
- 1. Introduction to Python for Data Visualization: Learners will study the basics of Python programming and its libraries for data visualization. They will gain foundational skills in using libraries like Matplotlib and Seaborn to create static visualizations.
- 2. Data Manipulation and Cleaning in Python: This module covers essential techniques for handling and cleaning data using pandas. Learners will learn how to prepare data for visualization and understand the importance of data quality in the visual analysis process.
- 3. Time Series Data Handling: Learners will explore how to work with time series data in Python, including parsing dates, resampling, and handling missing values. Practical skills in manipulating temporal data will be developed.
- 4. Creating Dynamic Visualizations: This module teaches learners how to create interactive and dynamic visualizations using libraries such as Plotly and Bokeh. They will understand the benefits of dynamic visualizations in presenting time-based data.
- 5. Advanced Matplotlib Techniques: Building on basics, this module delves into advanced features of Matplotlib, including customizing plots, animations, and working with large datasets efficiently.
- 6. Statistical Representations Over Time: Learners will study how to effectively represent statistical data over time using various chart types such as line plots, bar charts, and heatmaps. Practical skills in interpreting and communicating statistical information will be enhanced.
- 7. Geospatial Data Visualization: This module covers the visualization of geospatial data using Python. Learners will learn to plot maps and overlay temporal data to analyze spatial trends and patterns.
- 8. Advanced Data Aggregation and Grouping: In this module, learners will explore advanced techniques for aggregating and grouping time-series data to create more insightful visualizations. Skills in performing complex data analysis will be developed.
- 9. Real-Time Data Visualization: This module focuses on techniques for visualizing real-time data streams. Learners will understand the challenges and solutions in visualizing dynamic and continuously updated data.
- 10. Final Project: Time Series Data Analysis and Visualization: Learners will apply all the skills learned throughout the course by working on a comprehensive project that involves analyzing and visualizing a large dataset over time. This project will culminate in a professional-grade visualization.
Everything You Get With This Programme
Key Facts
For beginners with basic Python knowledge
No prior data visualization experience required
Create time-series visualizations
Analyze and interpret temporal data
Generate interactive plots with Python libraries
Ready to Advance Your Career?
Join thousands of professionals who have transformed their careers with LSBR.
Enroll Now — $99Why This Course
Enhance Analytical Skills: This certificate program equips professionals with advanced skills in data visualization using Python, a language widely used in data analysis. Learning to create dynamic and interactive visualizations can significantly enhance your ability to communicate complex data insights, making you a more valuable asset in data-driven industries.
Career Expansion: By mastering Python for visualizing data over time, professionals can expand their career opportunities in fields such as finance, healthcare, and technology. The ability to interpret and present time-series data effectively is highly sought after, opening doors to roles like data analyst, data scientist, or business intelligence specialist.
Improved Decision-Making: Understanding how to visualize data over time helps professionals make informed decisions based on accurate and visually intuitive data representations. This skill is crucial in industries where trends and patterns need to be quickly identified, such as market analysis, consumer behavior studies, and public health monitoring.
Estimated Completion
3-4 Weeks
Path to Certification
1. Enroll
Sign up and get instant access to all course materials.
2. Learn
Study at your own pace with expert-designed content.
3. Complete
Finish the programme in as little as 3-4 weeks.
4. Get Certified
Receive your industry-recognised certificate from LSBR.
Join Our Global Alumni Network
0
Graduates +
0
Career Growth %
0
Salary Increase %
0
Countries +
Course Brochure
Download our comprehensive course brochure with all details
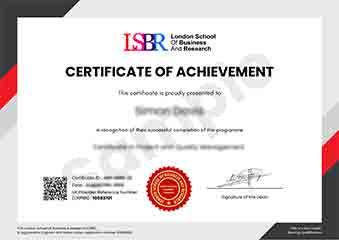
Sample Certificate
Preview the certificate you'll receive upon successful completion of this program.
Get Free Course Info
Enter your email and we'll send you the full course details, curriculum, and pricing information.
Is Your Employer Paying?
Many employers cover the cost of professional development. Request a corporate invoice and we'll handle everything — from enrolment to certification.
Trusted by 2,500+ Companies
From startups to Fortune 500 companies across 180+ countries.
What People Say About Us
Hear from our students about their experience with the Undergraduate Certificate in Visualizing Data Over Time with Python at LSBR School of Professional Development.
Oliver Davies
United Kingdom"The course provided high-quality materials that were both comprehensive and practical, equipping me with essential skills in visualizing data over time using Python. Gaining proficiency in these tools has significantly enhanced my ability to analyze and present time-series data, which is incredibly beneficial for my career in data science."
Tyler Johnson
United States"This course has been instrumental in enhancing my ability to visualize complex data trends over time, making my projects more compelling and easier to understand. It has significantly boosted my resume and opened up new opportunities in data analysis roles that require proficiency in Python for time-series data visualization."
Priya Sharma
India"The course structure was well-organized, providing a clear path from basic data visualization concepts to more complex time-series analysis techniques, which greatly enhanced my understanding and practical skills in visualizing data over time with Python. The comprehensive content and real-world applications have been invaluable for my professional growth in data analysis."
12 people are viewing this course right now